Pharmatech Insights
Mapping the companies behind the pharmaceutical supply chain
Find your next partner with the Pharmatech Map.
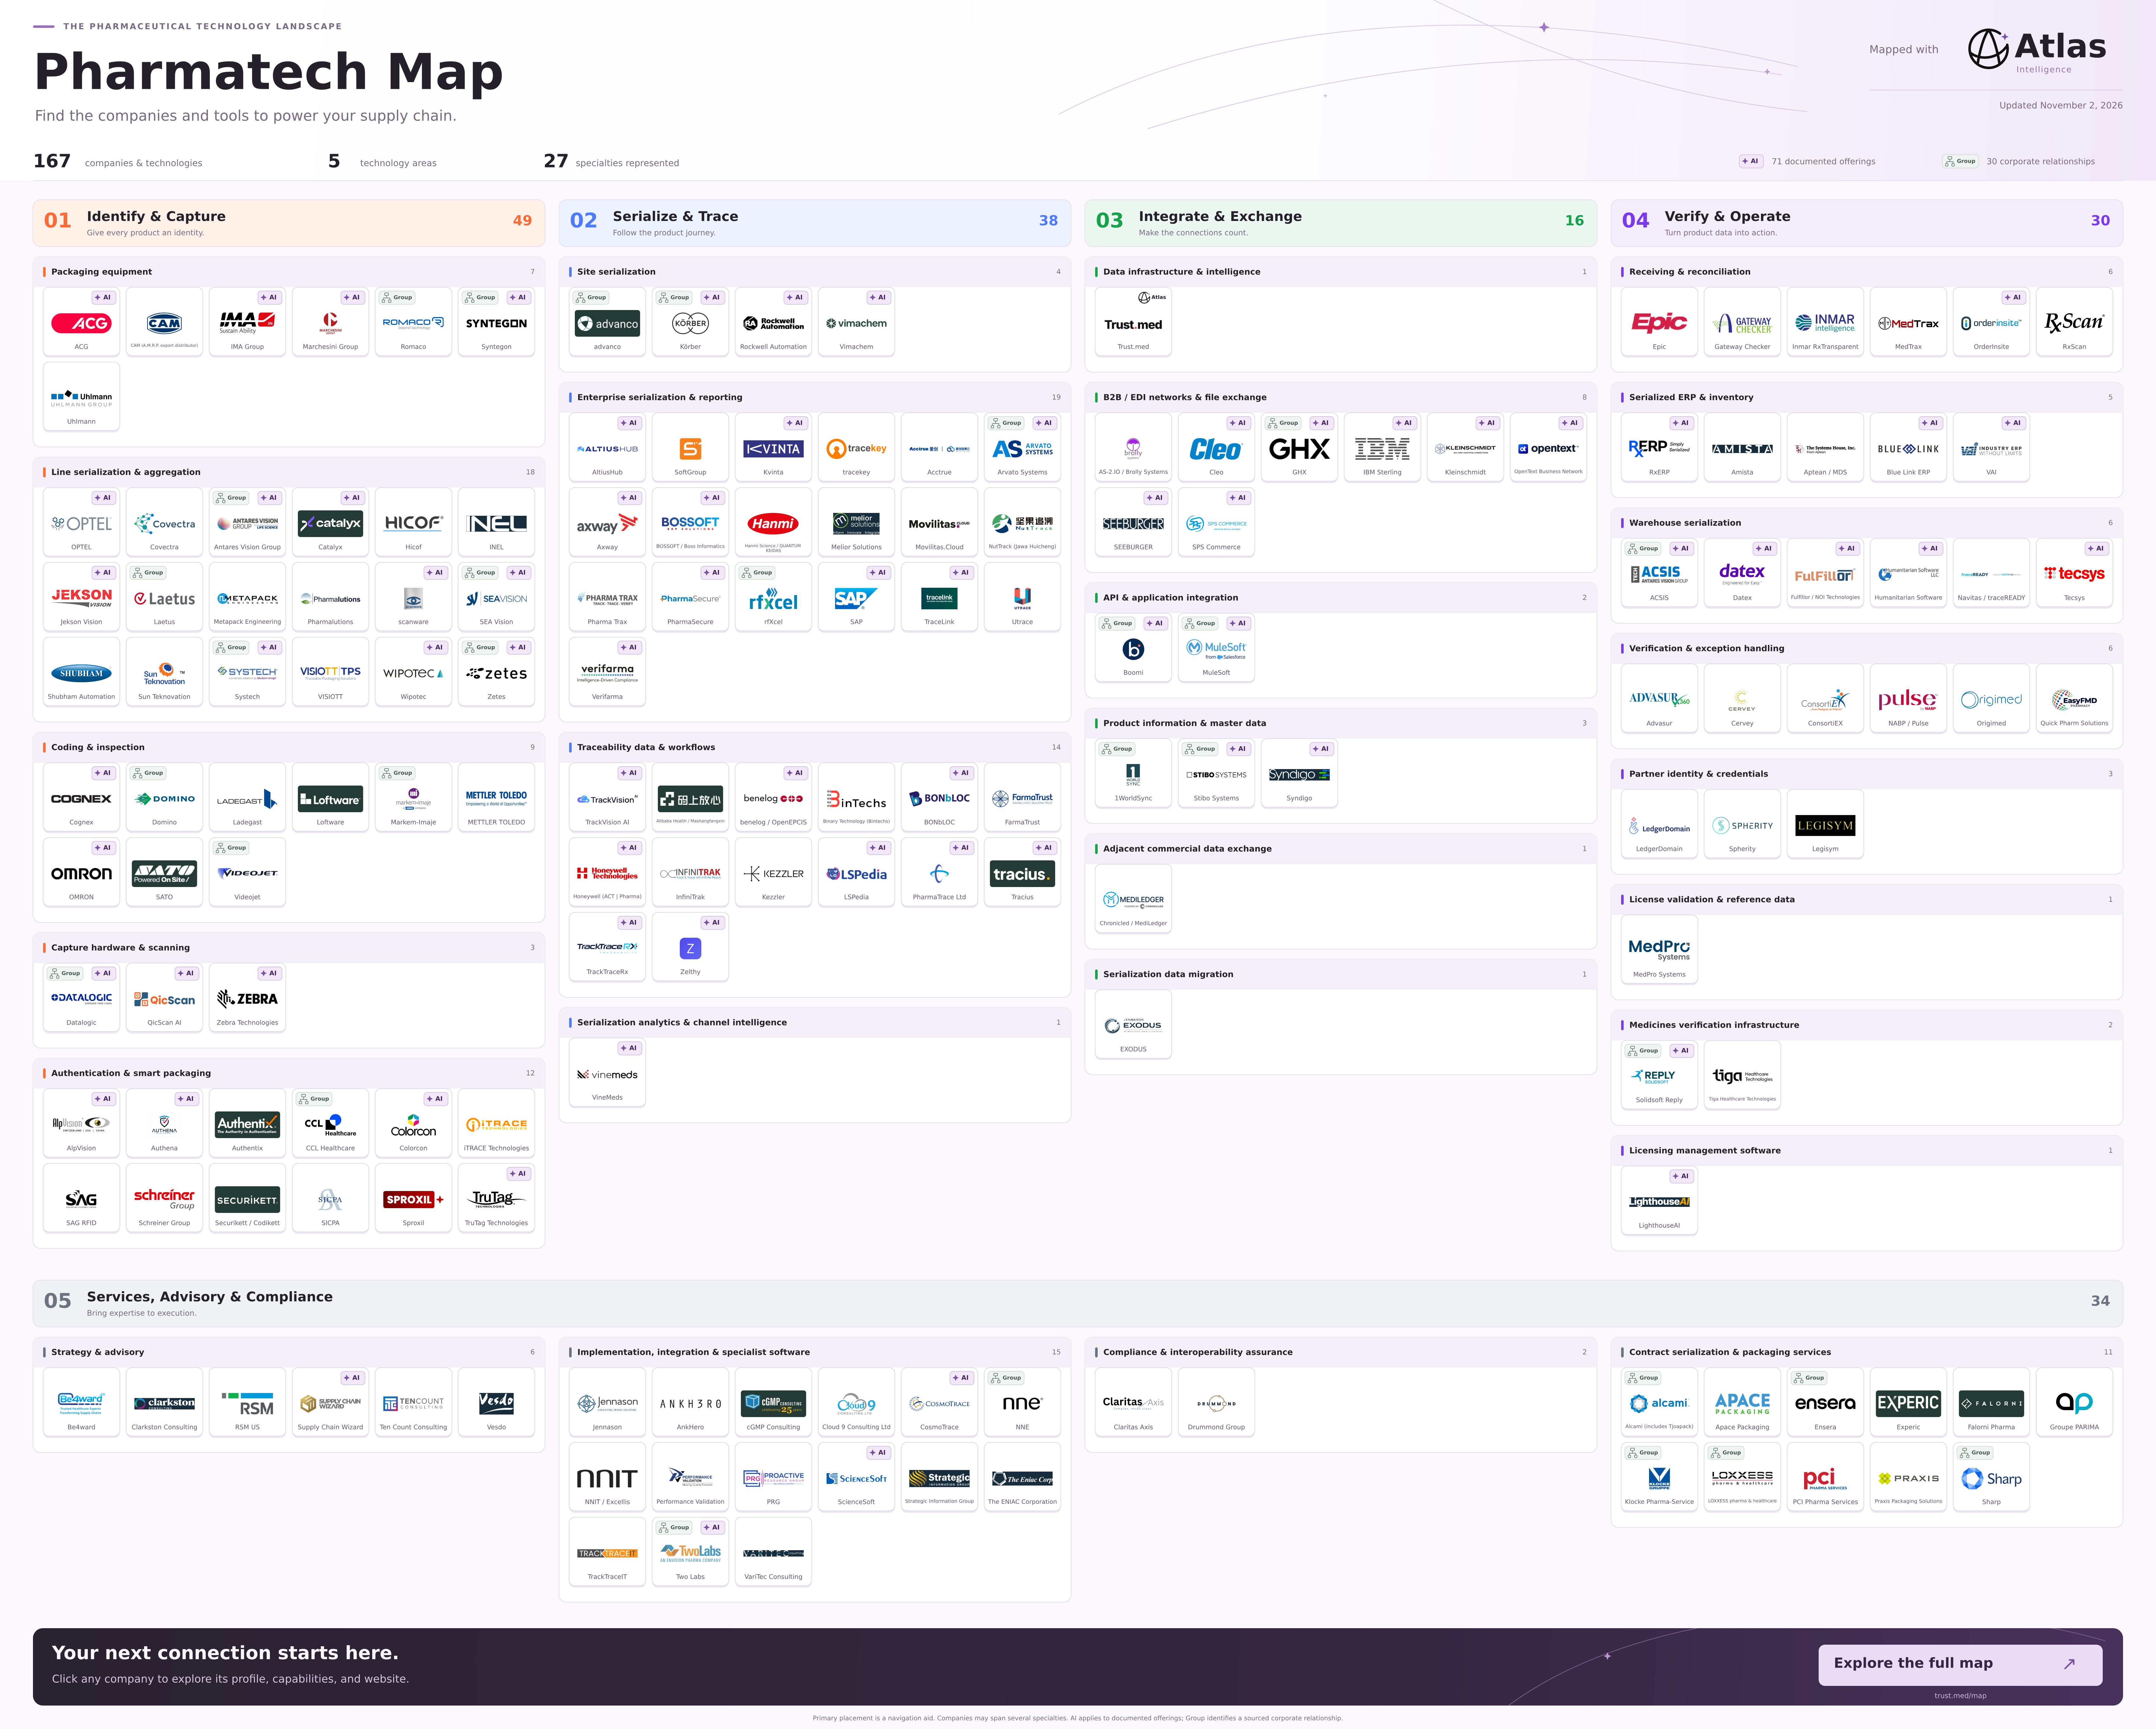
You shouldn’t have to wait for the right introduction to find a company worth talking to.
Across the pharmaceutical supply chain, companies are building tools and offering expertise that could help your team launch a product, connect systems, or solve a persistent operational problem. But unless you already know their names, finding them can take a lot of searching and a little luck.
We built the Pharmatech Map to make those connections easier to find. We put Atlas to work researching the ecosystem and brought 167 company, brand, and technology profiles into one place. You can start with the work you need to do, see who can help, and go straight to the companies that interest you.
For technology providers and service firms, it’s also a chance to be discovered. Someone looking through the map may be looking for exactly what your team does.
The problem rarely fits in one category
A manufacturer preparing to enter a market might need serialization software, packaging support, data exchange, and help getting trading partners connected. Those needs belong to the same launch, but they may involve several very different businesses.
The same thing happens with a smaller operational problem. A receiving team sees a mismatch between a shipment and its data. The cause might sit in the packing process, an integration, or the information sent by another partner. Choosing the next tool starts with understanding where the work needs to happen.
Switching serialization providers is another example. Choosing a new platform is only part of the job; historical data needs to move too. EXODUS helps with that transition through data extraction, EPCIS conversion, and reconciliation between platforms. It’s the kind of focused capability that can make a larger project easier to plan.
We organized the map around five areas to make those starting points easier to find.
THE LANDSCAPE
 AtlasIntelligence
Five ways into the landscape
167 profiles across 27 specialties. Choose an area to explore the companies and technologies.
More than serialization. Explore the equipment, data connections, operational tools, and expertise around it.
These categories give the map a structure, but a company’s capabilities often extend beyond its primary placement. Open a profile and look at what it does. A familiar serialization provider may offer something you haven’t considered. A specialist you’ve never heard of may work on exactly the problem you’re trying to solve.
For consultants and technology teams, that makes the map useful when assembling a solution. For manufacturers, distributors, and dispensers, it offers a way to explore options before starting a round of conversations.
Look for the job AI can help with
As we reviewed company websites, we found AI being applied to quite different kinds of work. Packaging inspection, document processing, integration design, and traceability investigations all show up in the map.
There are now 71 profiles with a documented AI offering or a capability that connects AI to business data. That tells us something about this collection of companies. It doesn’t tell us how widely those tools are used across the industry.
AI CAPABILITIES
AtlasIntelligenceWhere AI shows up
A larger technology area doesn’t always have a higher concentration of AI offerings. Compare the number of profiles with the AI capabilities we found.
| Technology area | AI / total | Share |
|---|---|---|
| Identify & Capture | 22 / 49 | 45% |
| Serialize & Trace | 22 / 38 | 58% |
| Integrate & Exchange | 12 / 16 | 75% |
| Verify & Operate | 11 / 30 | 37% |
| Services, Advisory & Compliance | 4 / 34 | 12% |
Integrate & Exchange has the highest concentration: 12 of its 16 profiles include an AI offering. The two largest areas each have 22.
The individual examples are more helpful than the total.
AltiusHub brings AI support into pharmaceutical traceability and compliance workflows, connecting packaging lines, serialization systems, and ERP software. OPTEL’s InspectProof uses AI vision to check details such as lot numbers, expiry dates, seals, and labels. TrackVision AI combines models trained on EPCIS supply chain data with language models to help teams explore product activity and spot patterns.
Different work, different reasons to consider AI. When you see the badge, open the profile and ask: would this help with something our team actually does?
We’ve made the AI sections more useful by naming the offering, explaining its purpose, and linking to the company’s own information. Where a feature is announced or in beta, that context matters too.
A profile can be the start of a conversation
The map works in both directions. Trading partners can discover technology and services. Technology companies and service providers can discover potential customers, find complementary services, and identify companies they could bring a solution to market with.
Each profile brings the basics together: what the company does, its capabilities, relevant offerings, and links to its website and, where confirmed, its company LinkedIn page. Sources are there for anyone who wants to look further.
We also show documented corporate relationships. Knowing that two brands belong to the same group can help you prepare better questions about their products, support, or how they work together.
If your company is listed, you can suggest corrections and add information through the profile’s Enhance or update your profile link. Useful details might include who you serve, the problems you help solve, or a resource that explains your product well. Our team reviews submissions before updating the page.
This is one way we put Atlas to work
Building the map meant working through scattered information, understanding how companies relate to one another, and giving people a useful way to act on what we found. As offerings change, that work continues.
It’s also a practical example of what we want Atlas to make possible for pharmaceutical supply chain teams: finding opportunities, making data useful, and helping partners resolve the issues that slow their work down.
Your starting point might be a new market, product master data that needs organizing, or an exception that keeps coming back. Those are different conversations, and we’d like to understand yours.
Talk with Trust.med about putting Atlas to work.
Explore your next connection
Start with a problem you’re working on. Search for a capability, explore a technology area, and open a few profiles. You might find a company to contact, a different way to approach the work, or a question worth asking your current partner.
Explore the Pharmatech Map or download the clickable PDF. Each company in the PDF links directly to its profile.
Updated November 2, 2026. Counts reflect the 167 published profiles, including companies, brands, and selected products. Each profile has one primary placement; 27 specialties currently contain published profiles. AI descriptions draw on company information, with sources and review dates linked in the profiles. The map is a resource for discovery, and its coverage continues to develop.
The Connection
Keep up with the systems behind the supply chain.
Get our monthly briefing on pharma data, compliance, and connected systems.